
Imprint: The content of this blog entry is based on VR experiments in the context of projects carried out in the scope of the authors masters degree studies at FHNW University of Applied Sciences and Arts Northwestern Switzerland under the supervision of Prof. Dr. Doris Agotai.
It is in the nature of cultural heritage data that datasets are often not complete or information is imprecise. We have briefly covered some of the challenges related to this issue in a previous blog post and will discuss this topic now more thoroughly.
Information uncertainty
In natural science the term “uncertainty” is used to describe doubt about the validity of the result of a measurement. This could be due to for example an error in measurement, transmission or conversion. In the context of cultural heritage uncertainty is rather referring to missing information or imprecision of data. And more generally, information uncertainty refers to the impreciseness, vagueness, fuzziness, inconsistency, doubt or likelihood present in information. According to Pham et al. some of the sources of information uncertainty include limited accuracy in data entry or transformation (for example limited precision), missing data, incomplete definition, imperfect realisation of a definition, inadequate knowledge about the effects of the change in environment, personal bias, ambiguity in linguistic description, approximation or assumption embedded in model design methods or procedures [1]. Consequently, visualization fidelity describes the accuracy and exactness in the visual representation of such information uncertainties.
Uncertainty visualization
According to Pang et al., uncertainty visualization is the “strive to present data together with auxiliary uncertainty information. These visualizations present a more complete and accurate rendition of data for users to analyze. […] The ultimate goal of uncertainty visualization is to provide users with visualizations that incorporate and reflect uncertainty information to aid in data analysis and decision making. [2] Although information uncertainty brings more complexity to the visualisation problem, it is crucial to consider this issue in data visualisation and exploration. Brunet and Andújar state that “most immersive (and non-immersive) visualizations nowadays are fundamentally biased and can be even unreliable“ because “data is usually presented as realistic and plausible 3D information” and “uncertainty is largely ignored by present applications and virtual environments” [3]. And MacEachren stresses that despite the long history in uncertainty visualization research, there is no generally accepted strategy for leveraging visualization to cope with uncertainty. He suggests to take a visual analytics approach to tackle the larger challenge which is not just to present data accurately but ultimately to enable reasoning under uncertainty in all its forms. [4]
All sources agree that a visual distinction is required for portions of a dataset or model that contain aspects of uncertainty. Let’s have a look at the domain of archeology for learnings and inspiration how this can be done.
Learnings from Archaeology
Dealing with uncertainty and incompleteness is by nature a common task in the field of archaeology. Yet the emergence of 3D visualization tools resulted in a strive for an increasingly higher level of detail in digital reconstructions of historical and archaeological artefacts. Though the resulting almost photorealistic visualisations did according to Roussou and Drettakis not improve the experience but rather led to an information overload and diverted the users attention to irrelevant details. And additionally, such hypothetical renderings carry a deceptive connotation of a higher level of information instead of being truthful about the actual fragmented knowledge. In the meanwhile, the trend has shifted towards less photorealistic, yet more credible forms of visualization that place greater emphasis on the differentiation of facts and assumptions. this evolution has been labeled by the authors as “realness factor” [5]. Also Gershon puts emphasis on the importance of an accurate representation of the degree of incompleteness and uncertainty of information. He recommends to demonstrate this by purposefully choosing a lower level of detail or using visual metaphors conveying this notion of incompleteness [6]. In «Fantastic reconstructions or reconstructions of the fantastic? Tracking and presenting ambiguity, alternatives, and documentation in virtual worlds» [7] the authors describe a set of dynamically adjustable variables including color schemes and opacity levels to render images that are more transparent about the presence of ambiguity, evidence, and alternatives in virtual reconstructions. And Strothotte, Masuch and Isenberg make the concrete proposal to visualize the degree of uncertainty in reconstructions by visual variables such as line width, ductus or sketchy layout style and suggest to purposefully leave out details [8].
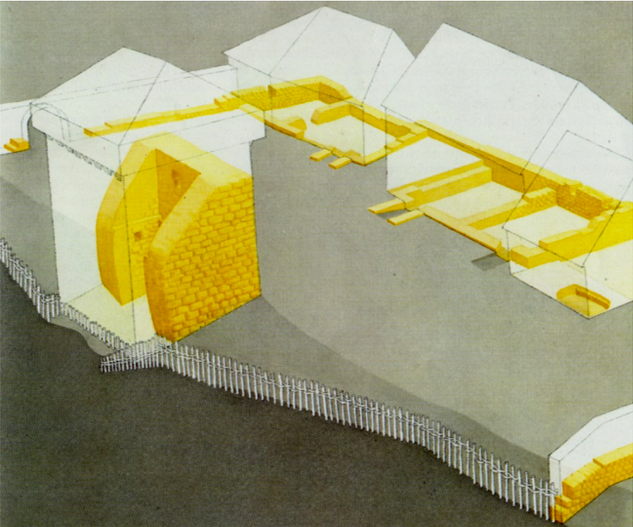
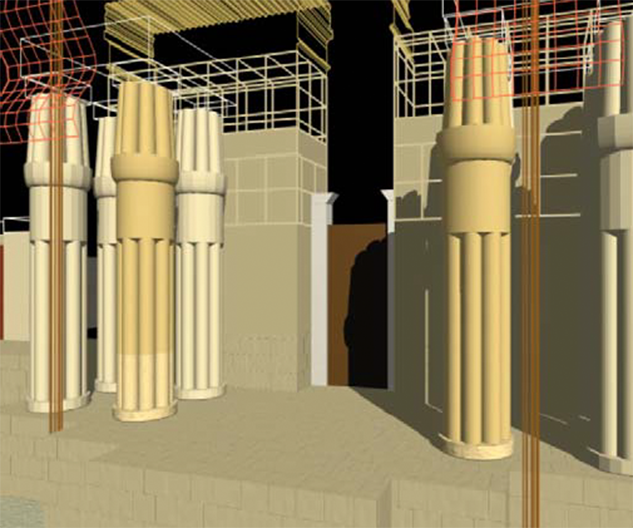
Figures 1 & 2: examples for visualization of uncertainty given by Strohotte et al. [8] on the left and Kensek et al. [7] on the right.
Robert W. Lindeman and Steffi Beckhaus share the viewpoint of reduction to the essential and introduce the term «Experimental Fidelity» which they define as follows: «Experiential Fidelity is an attempt to create a deeper sense of presence by carefully designing the user experience. We suggest to guide the user‘s frame of mind in a way that their expectations, attitude, and attention are aligned with the actual VR experience, and that the user‘s own imagination is stimulated to complete the experience.» [9]
All sources agree on the importance of visualization fidelity, and some also emphasize to focus on the essential which leads to better comprehension and prevents cognitive information overload.
Transfer into practice
How can the principles and learnings listed above be applied to projects in practice? It first starts with being conscious of the issue of information uncertainty, then carefully examining the dataset and questioning the apparent. A next step is searching for suitable forms of visualization in respect to this. Some techniques suggested by Pang et al. to make users aware of locations and degree of uncertainties in their data include adding glyphs, adding geometry, modifying geometry, modifying attributes, animation, sonification, and psychovisual approaches. [2] However there is no uniform solution and what visualisation strategies will be most expedient depends largely depends on the dataset, the presentation medium, goals to be achieved and last but not least the target audience. For this reason it is crucial to finally test and measure if the visualization concepts are understood by the target audience.
Some specific aspects where the topic of uncertainty visualisation needs to be considered in this project:
- geographical origin of objects: there are no geo-coordinates provided for the origin of the collection items and the textual description of the location of origin given in the dataset is rather vague. In many cases only the name of a region, province or even just the country of origin is stated. Anchoring items with a precise location marker such as a pin or a flag onto the map would imply a higher level of information than there is available. Some approaches to ensure visualization fidelity in this scenario would be to use a diffuse material (for example smoke, vapor or some kind of a particle system) or a rough sketched line for the anchor or leave out the fixture entirely and let the item float over an area.
- age determination: for most objects the dating is not a specific point in time but a textual description of a rather vague time interval such as an estimated time span, a century or an epoque. In order to dynamically process this information it has to be converted into an interval of numeric values. As in the example above, this implies a higher level of information than what is actually available. And when positioning items on a timeline it has to be considered if they will be displayed as a point and if so where this point would be located (start date, end date, mean value…) or rather as a vector with diffuse beginning and end points to reflect properly the information uncertainty aspect of this attribute.
Conclusion
There is not the one and only model solution how to deal with the issue of visualization of uncertainty, it always depends on the context, the objective and the target audience. Though it always starts with careful examination of the data at hand and challenging the obvious. And whilst aiming at the highest possible level of visualization fidelity one should at the same time be sensible to the user’s cognitive load. The goal is to find intuitive ways for the visualisation of uncertainty we are not just throwing even more information at the user.
[1] Binh Pham, Alex Streit and Ross Brown (2009): Chapter “Visualization of Information Uncertainty: Progress and Challenges” in “Trends in Interactive Visualization, State of the Art Survey”.
[2] Pang, A., Wittenbrink, C., and Lodh, S. (1997). Approaches to uncertainty visualization. Visual Comput. 13, 370–390.
[3] Brunet, Pere and Andújar, Carlos (2015): “Immersive Data Comprehension: Visualizing Uncertainty in Measurable Models”. Frontiers in Robotics and AI. URL: https://www.frontiersin.org/articles/10.3389/frobt.2015.00022/full
[4] MacEachren, Alan M. (2015): “Visual Analytics and Uncertainty: Its Not About the Data”. In Proceedings EuroVis Workshop on Visual Analytics (EuroVA). The Eurographics Association.
[5] Roussou, Maria and Drettakis, George (2003): “Photorealism and Non-Photorealism in Virtual Heritage Representation”. Proceedings of the International Symposium on Virtual Reality, Archeology and Cultural Heritage. Eurographics, Brighton, UK.
[6] Gershon, Nahum D. (1998): Visualization of an Imperfect World. IEEE Computer Graphics and Applications, p.43-45.
[7] Kensek, Karen M., Swartz Dodd, Lynn and Cipolla, Nicholas (2004): “Fantastic reconstructions or reconstructions of the fantastic? Tracking and presenting ambiguity, alternatives, and documentation in virtual worlds”.. Automation in Construction 13, Seiten 175-186. Elsevier, Amsterdam.
[8] Strothotte, Thomas, Masuch, Maic and Isenberg, Tobias (1999): “Visualizing Knowledge about Virtual Reconstructions of Ancient Architecture”. IEEE Computer Society. Proceedings Computer Graphics International, Seiten 36-43. The Computer Graphics Society, Los Alamitos, CA.
[9] Lindeman, Robert W. and Beckhaus, Steffi (2009): “Crafting memorable VR experiences using experiential fidelity”. Proceedings of the 16th ACM Symposium on Virtual Reality Software and Technology, Seiten 187-190. ACM, New York.